Dear Investors,
As the summer draws to a close we thought you would like to receive an update on your fund’s progress. As you will see below, the short term performance has been very pleasing as it has kept pace with the strong returns of the overall US markets while in the longer term we are managing to outperform. In fact, we have compared our performance to those of the investment manager returns reviewed by one of Canada’s largest pension consultants and are pleased that we at the top for the 3 and 4 year periods of all US equity managers. This matches the performance expectations of the originally tested “tracking portfolio” and is the basis for the fund in which we have all invested.
Perhaps, more important than the capital return is the actual growth of income in the fund. In our opinion, this is the one variable analysts spend too little time examining. In our first 4 years the portfolio’s income has grown from $1 to over $2! This represents a compounded growth rate of approximately 18% annually. It is very likely that these high rates of dividend increases will not be sustainable and growth rates will more likely be in the range of 10-12% as our historic results suggest. Regardless, if we continue to select companies whose financial strength supports increasing dividends the portfolio returns will follow along naturally and the risk of permanent capital loss will be mitigated.
The fund is progressing in line with all our expectations and we continue to believe it is, and always should be, a core holding for all investors.
PERFORMANCE RESULTS
The Bristol Gate US Dividend Fund mid 2013 results [January 1st through June 30th] continue to validate our investment discipline that stocks with the highest expected dividend growth will deliver superior results especially in difficult markets. These charts report the results for the six months [performance is net of all fees, including recoverable withholding taxes]:
| Performance Period to June | Class A Net in USD | Class A Net in CAD | Class H Hedged Net in CAD | S&P500 Total Return USD | Dividend Aristocrats Index |
| Six months | 13.36% | 19.84% | 14.65% | 13.82% | 14.74% |
| Three years [annualized] | 17.94% | 17.46% | 18.35% | 18.45% | 17.40% |
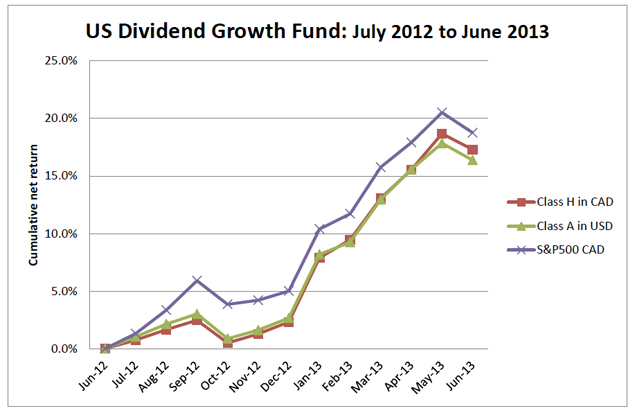
This period has been characterized by two phenomena. Firstly, the pace of recovery in the US equity markets has been striking, with the twelve month returns being among the very best in the past decade. Your fund has earned its gains without having any allocation to small caps or money centre banking institutions, which have lead the markets. Over the years our results have tended to match the equity markets when they rise, but they significantly outperform in down markets.
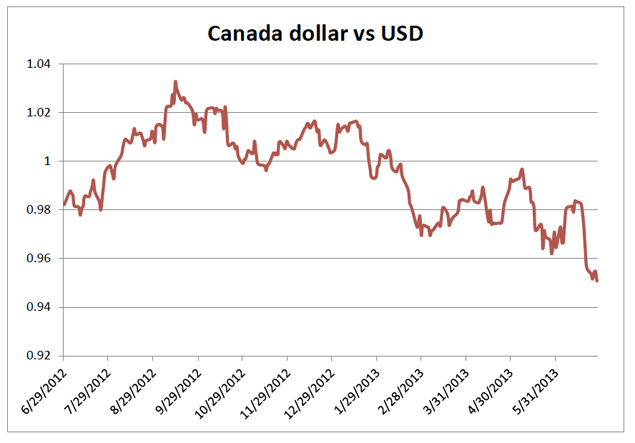
Secondly, in the period the Canadian dollar’s high value reached 1.0327, but has since declined to 0.9508. The United States dollar strengthened by nearly 2% against major currencies. Our hedging program [in the Class H series] has been consistent in delivering USD portfolio returns in Canadian dollars.
Over the two year period ending in June, 2012 and 2013 our Class A Units in USD and Class H in CAD returned 26%, while the broad US market returned 22%. Lagging have been the Canadian equity markets, which have lost 3.5% in this two year period.
PORTFOLIO FUNDAMENTALS
Analysis of macro-economic issues such as currency trends tends to miss the heart of our investment methodology and how it succeeds. It is directed at finding companies with high dividend growth – growth that we believe will be sustained. The chart following shows the actual growth in annual dividends in the fund for the original investors. The annualized growth in income exceeds 15%, which we believe substantially exceeds the results of most investment choices and provides the basis of dividend income for investors as their income requirements grow.
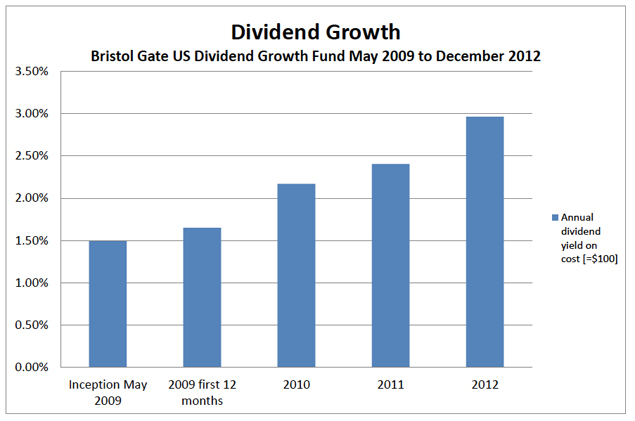
We believe this chart demonstrates the compelling reason for our investment discipline and its benefits.
Conventional valuation metrics for the portfolio at June 30th:
| Holdings | Price to 2013 EPS | Cash flow Growth | Return On Assets | Return On Equity | |
| Bristol Gate Fund | 22 | 13.1 | 6.6% | 10.1% | 32.3% |
| S&P500 | 500 | 14.2 | 6.6% | 8.2% | 19.8% |
We don’t find exceptional dividend growth in all sectors or industries. Hence our portfolios are typically more focused. Following is Morningstar’s analysis of the sector distribution of the Fund’s portfolio. Our commitment to consumer cyclicals and media [Ross Stores, Target, CBS and Disney], reflects our belief the economic recovery now underway in the United States. Our focus on industrial companies has been maintained.
| SECTOR | Portfolio Weight | S&P 500 Weight |
| CYCLICAL | 50.95% | 31.25% |
| Materials | 4.62% | 3.21% |
| Consumer cyclical | 36.67% | 11.29% |
| Financial services | 9.66% | 14.79% |
| Real estate | ||
| SENSITIVE | 37.33% | 45.21% |
| Communications | Nil | 4.53% |
| Energy | Nil | 11.26% |
| Industrials | 31.02% | 10.84% |
| Technology | ||
| DEFENSIVE | 13.52% | 26.65% |
| Consumer defensive | 9.02% | 11.41% |
| Healthcare | NIL | 11.81% |
| Utilities | 4.61% | 3.43% |
Source: www.morningstar.com Companies in the index are weighted by market capitalization.
CURRENT EVENTS
It has been a busy year-to-date for Bristol Gate. We have made three major advances in our operations.
- Bristol Gate US Dividend Growth Offshore Fund: Our fund has been established in the Cayman Islands and is available for international investors – not US or Canadian [ for taxation and security administration purposes]. The fund maintains bank accounts in USD and EURO at Scotiabank Bahamas in Nassau. Our auditors are PricewaterhouseCoopers. This fund wll be managed to follow the same dividend fund growth investment methodology as we have developed.
- Registration to offer securities in Quebec: we have completed the securities registration process to serve residents of Quebec.
- Completion of four years of performance: The Class H units of the Fund were initialy issued in May 2009 and we now have four years of performance to support our marketing efforts. We know that over the four year period our results place Bristol Gate at the very top of equity managers.
As always we will continue to manage the portfolio with care and discipline knowing that mistakes happen when neither of these is followed. We thank you for our trust and confidence and welcome your comments or visits at your convenience.
We wish you all the best for the balance of 2013.
Yours sincerely,
Sincerely,
| Richard Hamm Chief Executive Officer  |
Peter Simmie Chief Investment Officer  |